

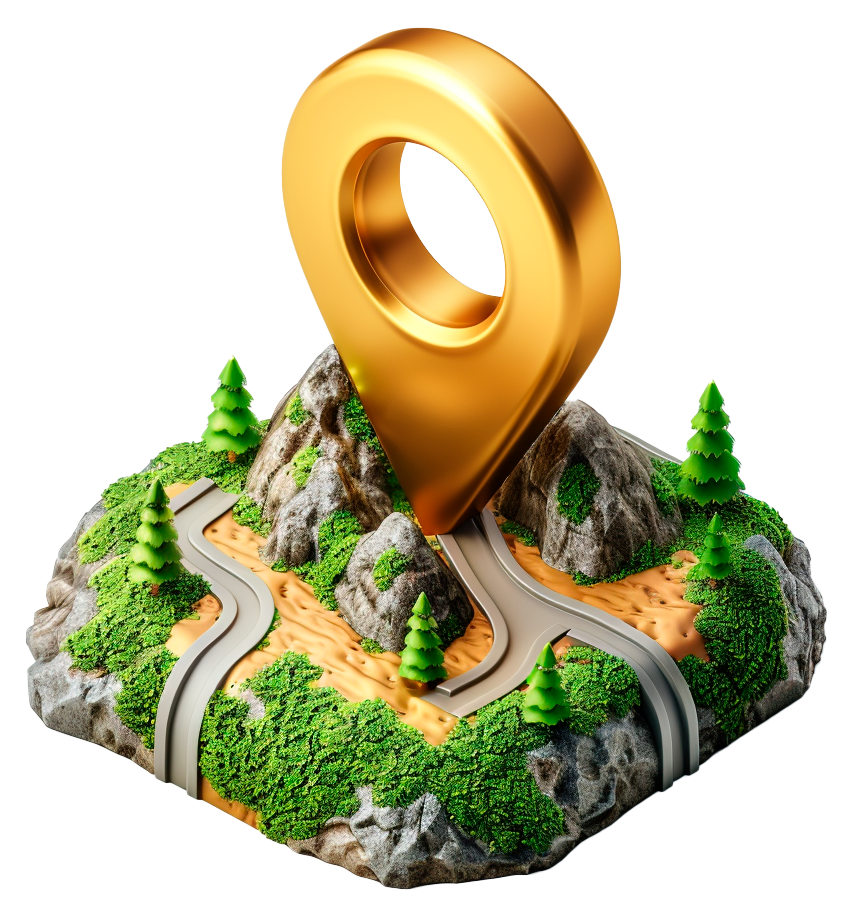
Map Icons
The Miydi Map Icons set is a key resource for anyone seeking optimized mapping tools, freely available under the Creative Commons License. Designed with precision and compatibility in mind, these icons enhance the visual quality of maps created in QGIS and support a wide range of geospatial visualization needs. By leveraging these free resources, users can achieve professional-grade mapping results without the overhead of commercial software or proprietary restrictions.
These icons are specifically tailored to integrate smoothly with QGIS, ensuring that both novice and expert GIS users can take full advantage of their features. The inclusion of these icons as part of your mapping toolkit can significantly improve the readability and aesthetic appeal of your projects, making complex data more accessible and easier to understand.


How to Use
Add the Icons to QGIS and integrate with OSM Data
The code provided is used within QGIS’s Expression Builder to control the size of the symbols representing the centroids of features based on the map’s scale and the area of the features. Here’s a breakdown of each part of the code:
min(
    max(
        sqrt($area) / (@map_scale / 2500) * 0.2,  -- Increased scaling factor for larger size
        12  -- Increased minimum size for better visibility when zoomed in
    ),
    60  -- Slightly increased maximum size for larger appearance when zoomed out
)-
sqrt($area): This function calculates the square root of the area of the feature. Taking the square root helps in reducing the range of area values to a more manageable scale, which aids in more uniform symbol sizing. -
@map_scale / 2500: Here,@map_scalerefers to the current map scale. Dividing this by 2500 adjusts the scale factor so that the symbol size calculation is balanced against the actual size of the map being viewed. -
* 0.2: This multiplication factor adjusts the scaling further, tuning the overall size of the centroids to ensure they are neither too large nor too small across various map scales. The value0.2can be adjusted based on specific visualization needs. -
max(..., 12): Themaxfunction ensures that the calculated size never falls below 12mm, which helps maintain visibility when the map is zoomed in. -
min(..., 60): Conversely, theminfunction caps the maximum size at 60mm to prevent the centroids from becoming too large when the map is zoomed out, ensuring that the map remains uncluttered and visually appealing.
Implementing the Code in QGIS
To use this expression in QGIS:
-
Open Layer Properties: Right-click on the layer for which you want to set the centroid size and select
Properties. -
Navigate to Symbology: Go to the
Symbologytab within the Layer Properties dialog. -
Set Size Expression: Find the size setting for your centroid symbol and click on the expression editor button (it looks like an “ƒx” symbol). Paste the provided code into the expression editor.
-
Save and Apply: Confirm your settings by clicking
OKorApply. The map will now render the centroids using the sizes calculated by the expression based on the current zoom level and the area of each feature.


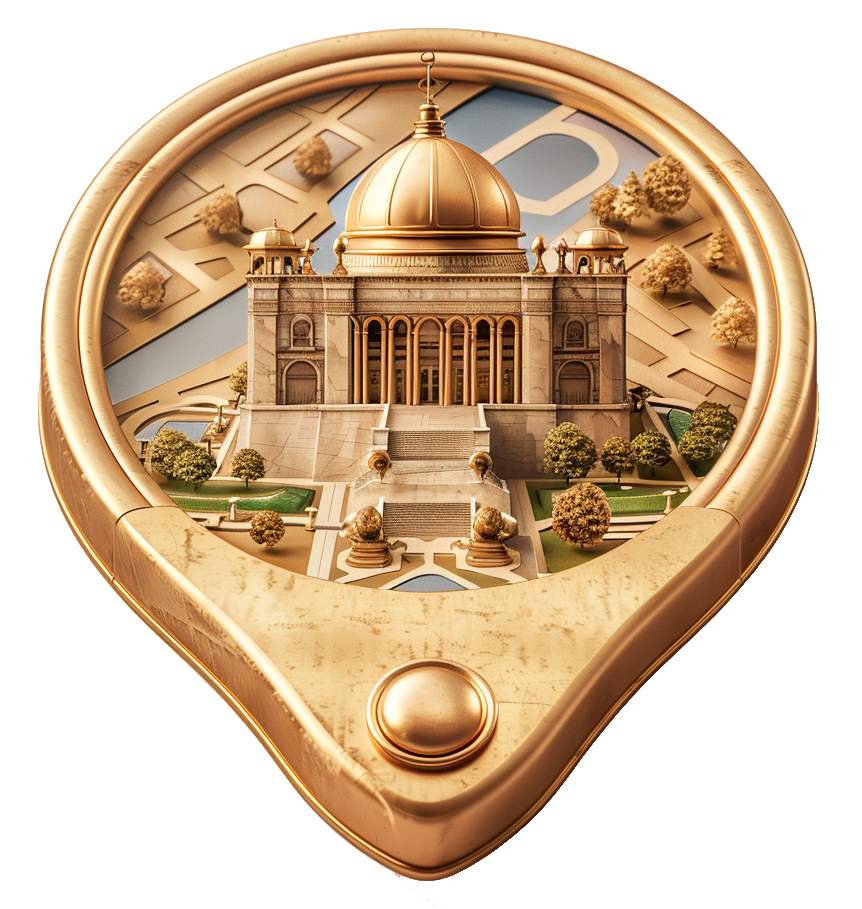
Optimized Icons
Designed around OSM map categories
We encourage you to utilize these icons in your various mapping endeavors and to contribute back to the community by sharing your enhancements or adaptations of the icons. Together, we can continue to expand and refine these resources, making them even more valuable to mappers everywhere.